Climate analysis
Long-term atmospheric time series, ERA5 reanalysis, climate trends, and dynamic and thermodynamic interpretation of the atmosphere.
METEOROLOGY · CLIMATE · DATA · NATURAL HAZARDS
I transform complex atmospheric and geospatial data into patterns, visualisations and clear insights to support the understanding of climate change and natural hazards.
Professional profile
Environmental scientist specialised in natural hazard planning and management, with experience in climate analysis, meteorology, environmental data management and science communication.
Long-term atmospheric time series, ERA5 reanalysis, climate trends, and dynamic and thermodynamic interpretation of the atmosphere.
Python, Xarray, Dask, NumPy, Pandas, Scikit-learn, R and statistical analysis applied to multidimensional and geospatial data.
Specialisation in atmospheric hazards, cut-off lows, Mediterranean extremes, air quality and technical support for risk planning.
Experience at Meteored with 108 published articles and the ability to communicate meteorological and scientific information to technical and general audiences.
Technical portfolio
A selection of projects in climate analysis, meteorology, environmental science, GIS and data visualisation.
Analysis of atmospheric patterns and trends across the western Atlantic–Mediterranean sector during 1940–2025. The project processes ERA5 data with Python and combines dimensionality reduction, unsupervised learning, non-parametric statistics, climate mapping and back trajectories to investigate changes in circulation, moisture and air-mass provenance.
Download Master’s Thesis presentation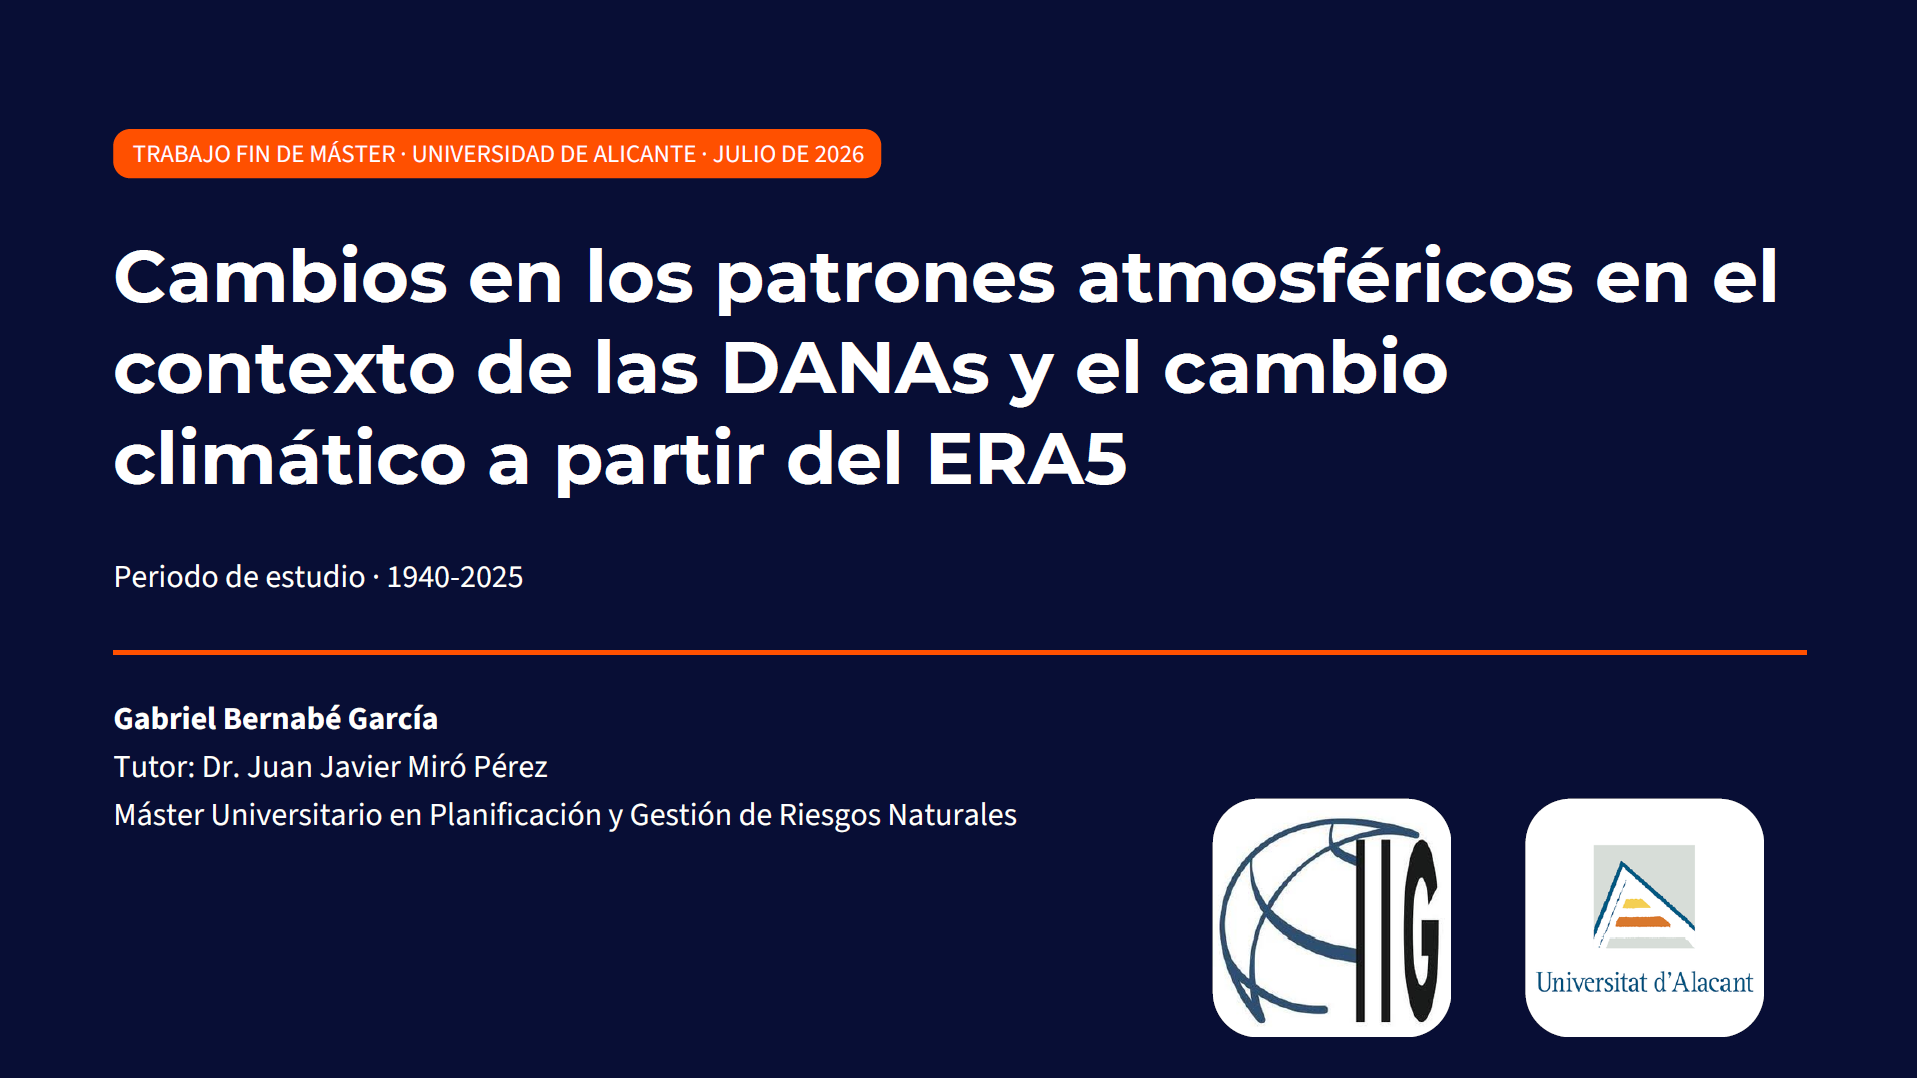
Experimental study of the influence of relative humidity on aerosol light scattering in a suburban environment during 2023. The project combines nephelometry, data correction and validation, statistical analysis with RStudio, multilinear regression and HYSPLIT to interpret the effects of humidity, particle size and Saharan dust intrusions.
Download Bachelor’s Thesis presentation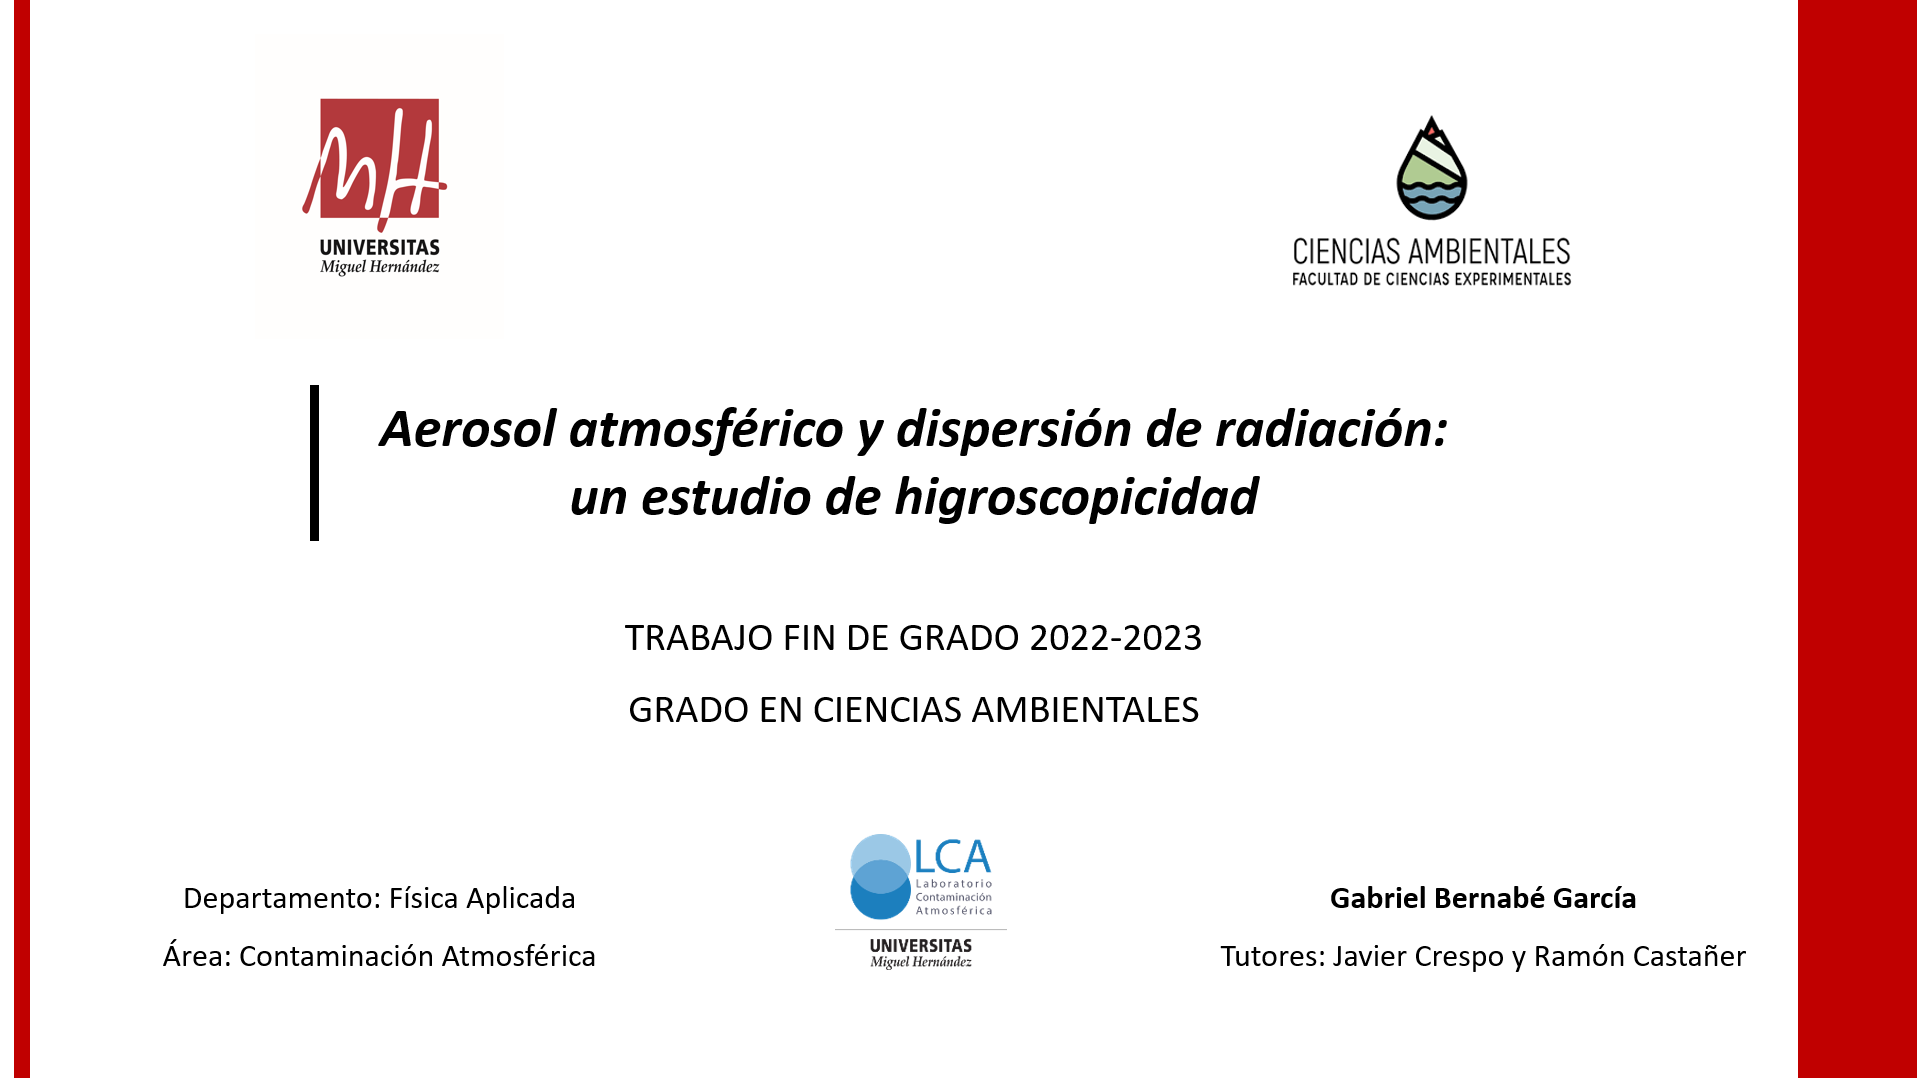
Creation of three-dimensional models of the Canary Islands, Hawaii and south-eastern Spain from GeoTIFF files processed with QGIS and Blender.
Source: United States Geological Survey (USGS).
Download imagesInteractive map of 393 healthcare facilities in the province, including information on facility type, capacity, location and their relationship with population distribution.
Explore mapInteractive visualisation of provincial population, sex distribution and the ten most populous cities, developed with RStudio, Leaflet, sf, tidyverse and mapSpain.
Explore mapDashboard for exploring the presence, status and diversity of species recorded in national parks, while considering inventory limitations and taxonomic changes.
Open dashboardDashboard on volcanic eruptions using geographic, physical and socioeconomic data, including VEI, damage, casualties and associated phenomena.
Source: NOAA National Centers for Environmental Information.
Download Power BI
About me
I hold a BSc in Environmental Sciences from Miguel Hernández University and an MSc in Natural Hazard Planning and Management from the University of Alicante. My background combines atmospheric science, data analysis, environmental management and weather communication.
In my Master’s Thesis, I analysed 86 years of daily ERA5 data using Python, Xarray, Dask and Scikit-learn, applying IncrementalPCA, K-Means, Mann-Kendall, Sen’s slope, Cartopy and HYSPLIT. My Bachelor’s Thesis experimentally examined interactions between humidity, aerosols and radiation using nephelometers, RStudio and statistical analysis.
I have worked as a weather writer and forecasting intern at Meteored and as an environmental technician at the Port Authority of Alicante. I am seeking international opportunities in climate and environmental data analysis, meteorology, natural hazards, GIS and science communication.
Download CVLet’s connect
Available for junior opportunities, projects and collaborations related to climate, meteorology, geospatial data and natural hazards.